

検査結果のeGFRを見て、「前回より少し下がった」と気になることはありませんか。腎臓の状態を知るには、今回の値に加えて、過去からどのように変わってきたかを見ることも大切です。
その変化の速さを表すのがeGFRスロープです。春日部大西毎日腎クリニックでは、通院中の採血結果からeGFRスロープを算出し、検査結果に添えてお渡ししています。
eGFRスロープは、1年あたりの変化量
eGFRは、血液をろ過する腎臓の働きを推定した数値です。スロープは「傾き」の意味で、採血日を横軸、eGFRを縦軸に並べたときに、数値がどのくらいの速さで変わっているかを表します。
たとえばスロープが−2 mL/分/1.73m²/年なら、算出に使った期間では、eGFRが1年あたり平均して2ずつ低下する傾向だった、と読みます。「腎機能が毎年2%減った」という意味ではありません。
マイナスなら低下方向、ゼロに近ければ大きな変化の少ない傾向です。ただし、その値だけで良い・悪いを決めるわけではなく、現在のeGFRや尿蛋白も合わせて判断します。
今回のeGFRが50でも、過去を並べると違いがある
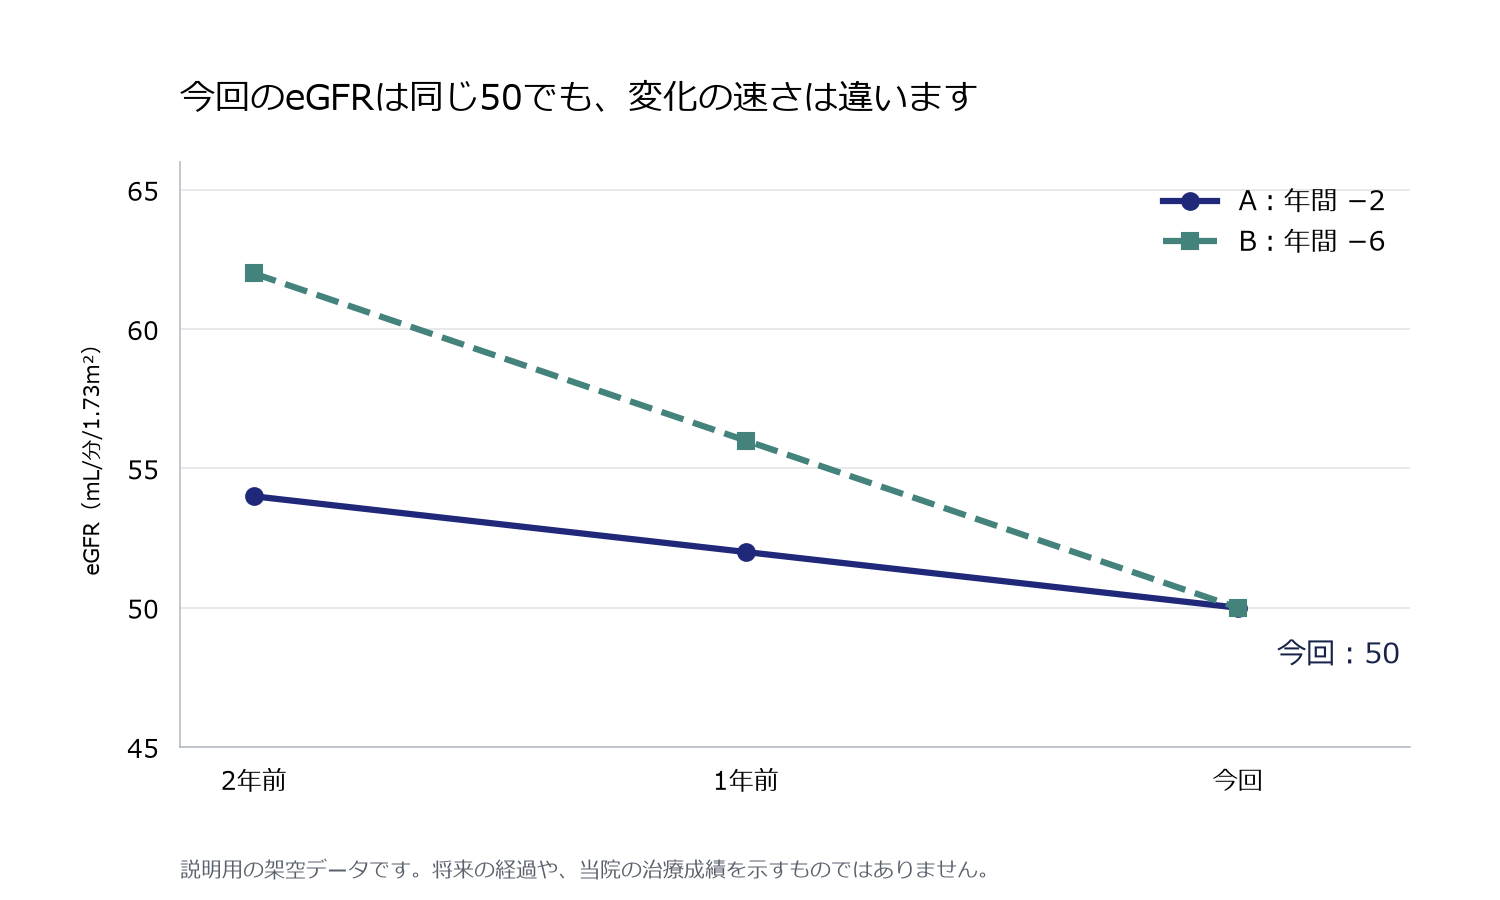
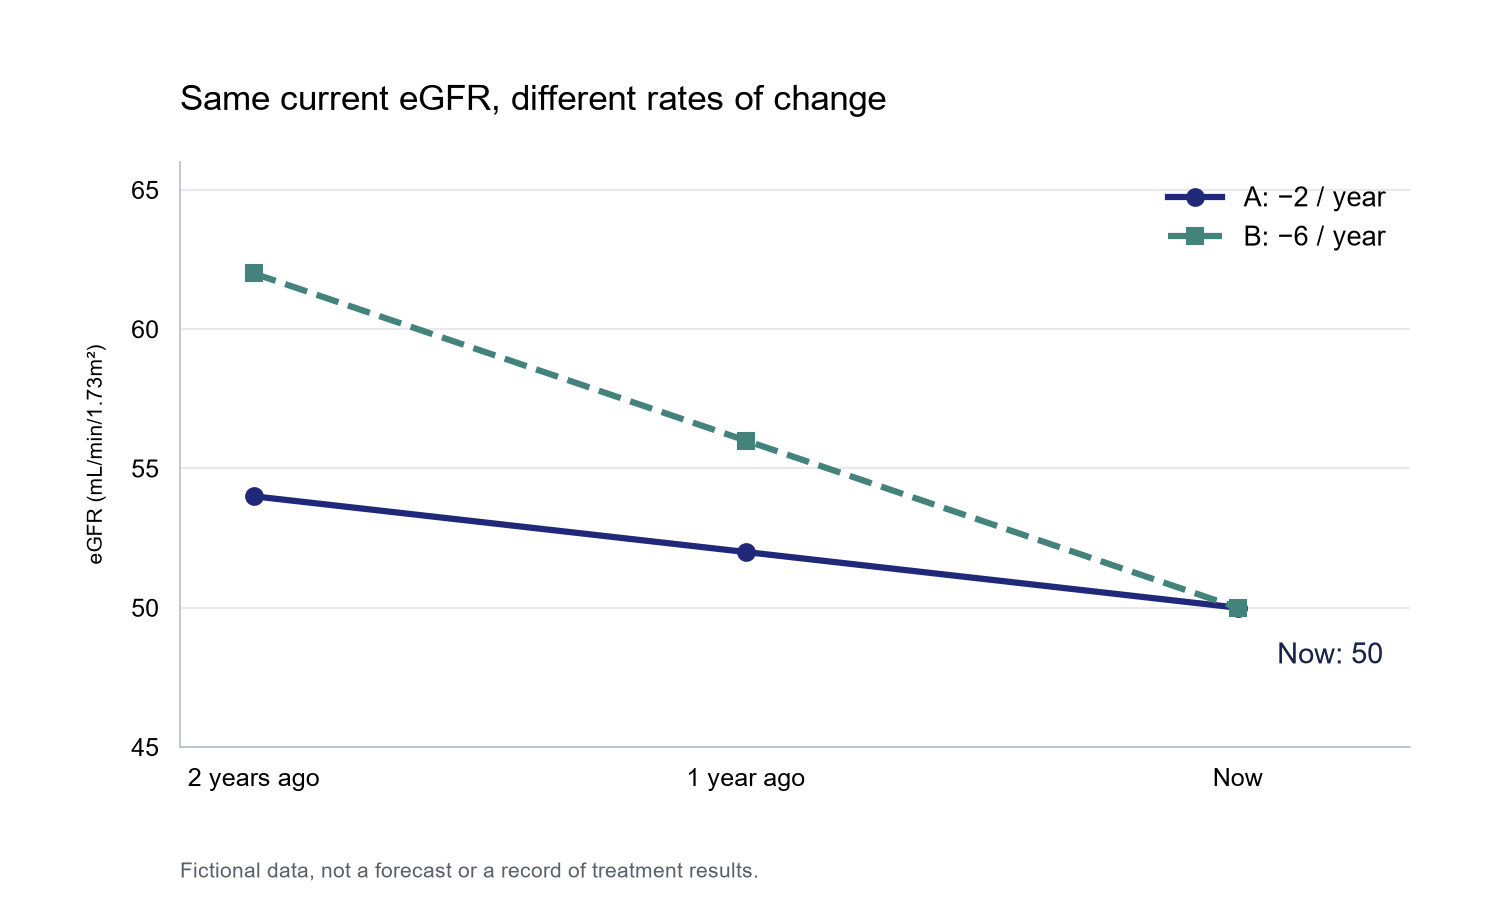
冒頭の図は説明用の架空データです。Aは2年前から54、52、50、Bは62、56、50と変化しています。どちらも今回のeGFRは50ですが、年間の変化量はAが−2、Bが−6です。
今回の値だけでは見えなかった違いが、過去の検査を並べることで分かります。Bのような低下が続いている場合には、原因や治療内容を確かめる必要があります。
一方、この線をそのまま将来まで延ばして「あと何年で透析」と決めることはできません。治療や体調によって経過は変わります。この図も将来の予測や、当院の治療効果を示したものではありません。
低下を緩やかにする意味が、研究でも確かめられている
14の集団をまとめた2019年の観察研究では、eGFRの低下が緩やかな人ほど、その後に末期腎不全に至るリスクが低いという関連が認められました。[1]
さらに、2023年には66試験・186,312人のデータを用いた解析が報告されています。治療によるGFRスロープの改善と、腎不全などの臨床的な結果への効果に強い関連があり、臨床試験でスロープを評価に使う根拠となっています。[2]
ただし、試験で多数の人を比較して得られた結果と、一人の短期間の検査結果は区別が必要です。スロープが少し改善しただけで、その方への治療効果を断定できるわけではありません。
74から70へ下がったら? 2回だけの計算では極端な値になることも
クレアチニンには生理的な上下があり、測定上のばらつきもあります。その値から計算するeGFRも、毎回まったく同じにはなりません。短期間の2回や3回だけで直線を引くと、この上下を年間の変化に引き伸ばしてしまうことがあります。[3]
次のように、2か月間隔で採血した場合を考えてみましょう。説明用の架空データです。
74 → 70 → 72 → 72
初回 → 2か月後 → 4か月後 → 6か月後
eGFRの単位:mL/分/1.73m²
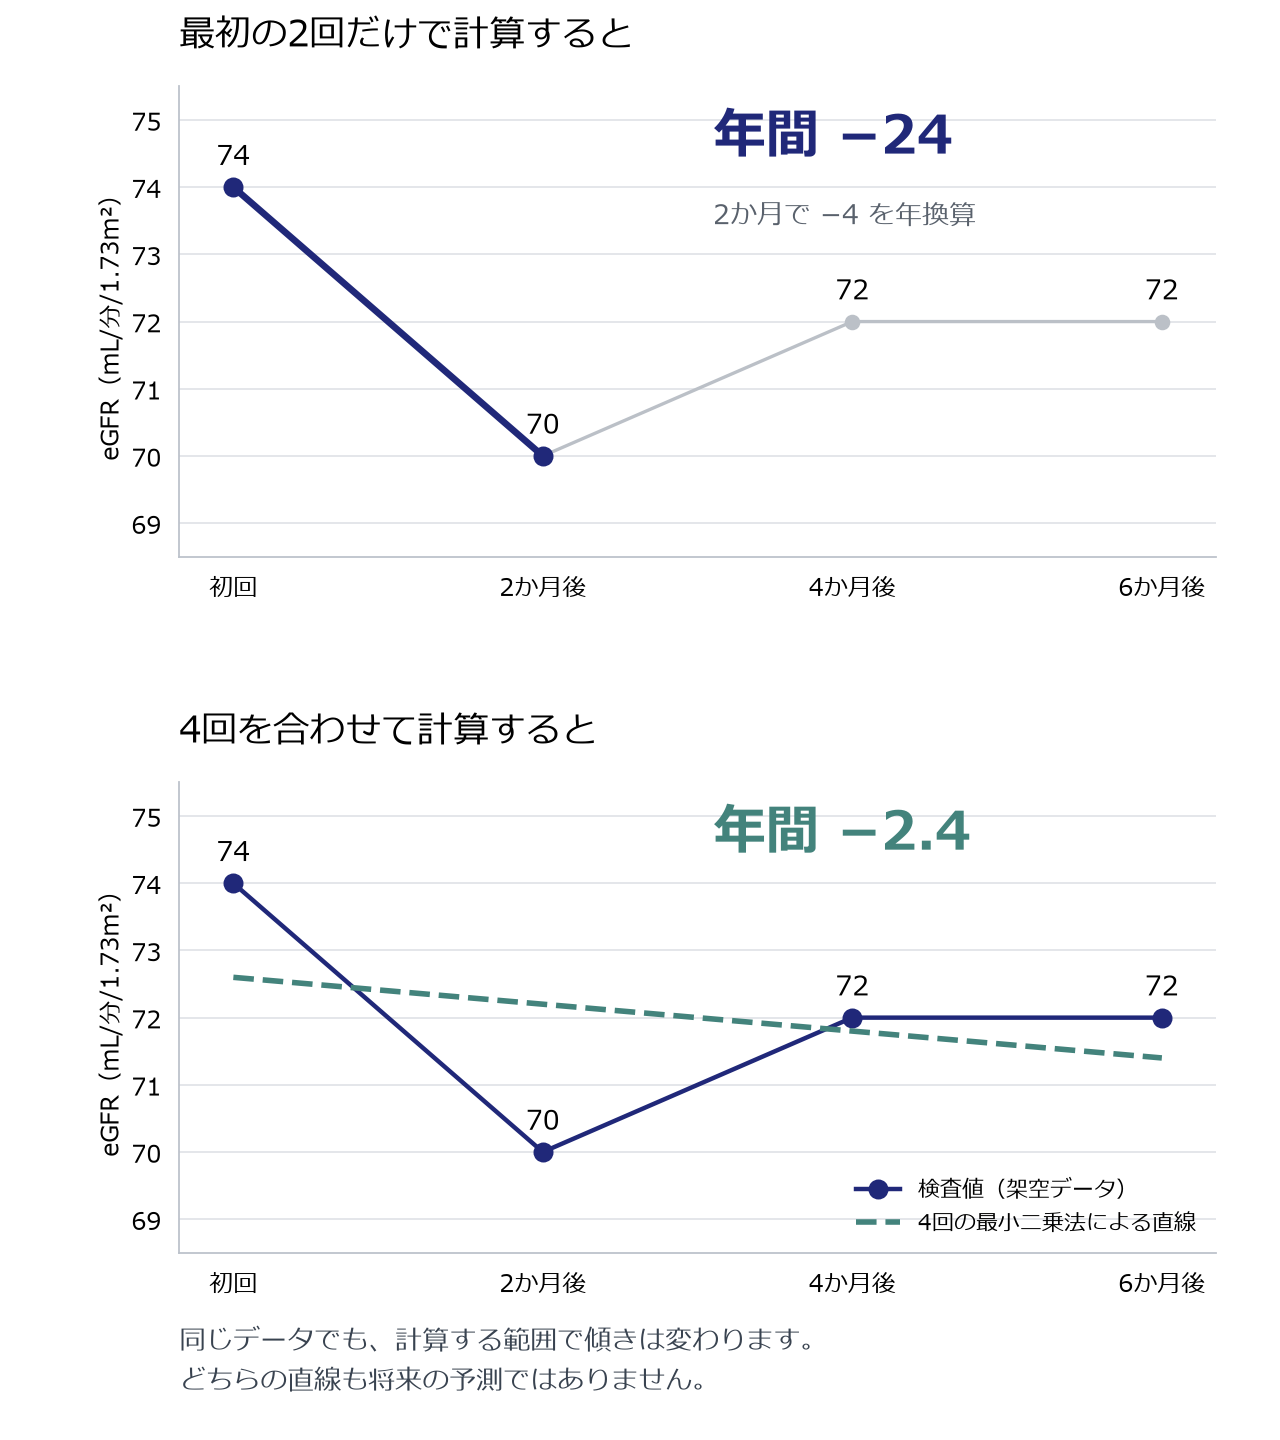
最初の2回だけなら、年換算で−24。74から70への変化は約5.4%で、生理的・測定上の変動でも起こり得る大きさです。ところが、2か月で4下がった傾きを1年分に換算すると、−24 mL/分/1.73m²/年になります。これは「今後1年間で24下がる」と予測した数字ではありません。
4回を最小二乗法で計算すると、年換算で−2.4。その後の72、72まで含めると、最初の2回とは印象が変わります。70前後で上下している経過とも考えられますが、数式で求める直線には、まだ小さな右下がりが残ります。
この例だけで腎機能が悪化しているとも、完全に横ばいとも断定はできません。大切なのは、マイナスという符号や表示の色だけで判断せず、複数回の採血結果を継続して見ていくことです。計算した数値と、実際の値の並び方、尿蛋白や体調を合わせて読みます。
なお、「20%以内なら問題ない」という意味でもありません。症状や急な変化がある場合には、その都度評価します。[3]
短い期間の変化と、長い期間の傾向を分けて読む
同じ人でも、計算に使う期間や検査の回数によってスロープは変わります。短期間の少数の測定では一時的な上下の影響を受けやすく、長い期間で平均すると最近の変化が目立ちにくくなることもあります。年間の数値とともに、元の検査結果の並び方を見ることが大切です。
クレアチニンから求めるeGFRは、筋肉量や食事などの影響も受けます。KDIGO 2024では、経時的な変化を読む際にこうした誤差を考慮するよう示しています。CKDの方で次の検査時にeGFRが20%を超えて変化した場合は、通常の変動を超える可能性があり、評価が必要です。これは年間スロープの基準ではありません。[3]
また、SGLT2阻害薬などの治療開始後には、初期にeGFRが下がり、その後の低下が緩やかになる場合があります。薬を始めた直後の変化と、その後の傾向を分けて見ます。検査値だけで薬を中止せず、処方医に確認してください。[3]
急な腎機能の悪化が疑われるときは、スロープを計算するために次の採血まで待つのではなく、その原因を調べます。
What is eGFR slope? Understanding changes in kidney function
A small fall in eGFR since your last blood test can be worrying. To understand kidney function, it helps to look at both the latest result and how it has changed over time.
eGFR slope describes the rate of that change. At our clinic, we calculate it from blood tests taken during follow-up and include the annual change with your test results.
A change per year, not a percentage
eGFR is an estimate of how well your kidneys filter blood. When test dates are plotted along the horizontal axis and eGFR values along the vertical axis, the slope describes how quickly the values change.
A slope of −2 mL/min/1.73m²/year means that, over the period used in the calculation, eGFR tended to fall by an average of 2 units a year. It does not mean kidney function fell by 2% each year.
A negative value indicates a downward trend; a value near zero indicates relatively little overall change. Interpretation also depends on the current eGFR and protein in the urine.
The same current eGFR can follow different paths
The first graph uses fictional data. Over two years, person A has values of 54, 52 and 50, while person B has 62, 56 and 50. Both now have an eGFR of 50, but their annual changes are −2 and −6, respectively.
Looking back reveals a difference that the latest result alone does not show. A continuing decline like B’s calls for review of the cause and treatment.
The line cannot simply be extended to predict when dialysis will be needed. Illness and treatment can change the course. These figures are examples, not predictions or evidence of this clinic’s treatment results.
What research tells us
A 2019 analysis of 14 observational cohorts found that a slower fall in eGFR was associated with a lower subsequent risk of end-stage kidney disease. [1]
A 2023 analysis of 66 trials involving 186,312 participants found a strong relationship between treatment effects on GFR slope and effects on clinical outcomes such as kidney failure. This supports using slope as an outcome measure in trials. [2]
Results from large groups do not establish the effect of treatment in one person from a few short-term tests. A small improvement in an individual’s slope is not, by itself, proof that treatment is working.
How our clinic reports the result
We use several blood test results taken during follow-up and a calculation called least-squares regression. It fits a straight line through the overall pattern of test dates and eGFR values, then expresses its slope as a change per year.
This helps review the accumulated results rather than focusing only on the last two tests. Please look at the annual change alongside the current eGFR. Bring previous health-check or blood-test reports from other clinics if you have them; they can help us understand the history.
74 → 70 → 72 → 72: why two tests can be misleading
Creatinine naturally varies, and laboratory measurements also have some variability. eGFR calculated from creatinine therefore does not stay exactly the same at every test. Using only two or three results over a short period can magnify this variation when the slope is expressed per year. [3]
Consider fictional eGFR results of 74, 70, 72 and 72, measured at the first visit and 2, 4 and 6 months later.
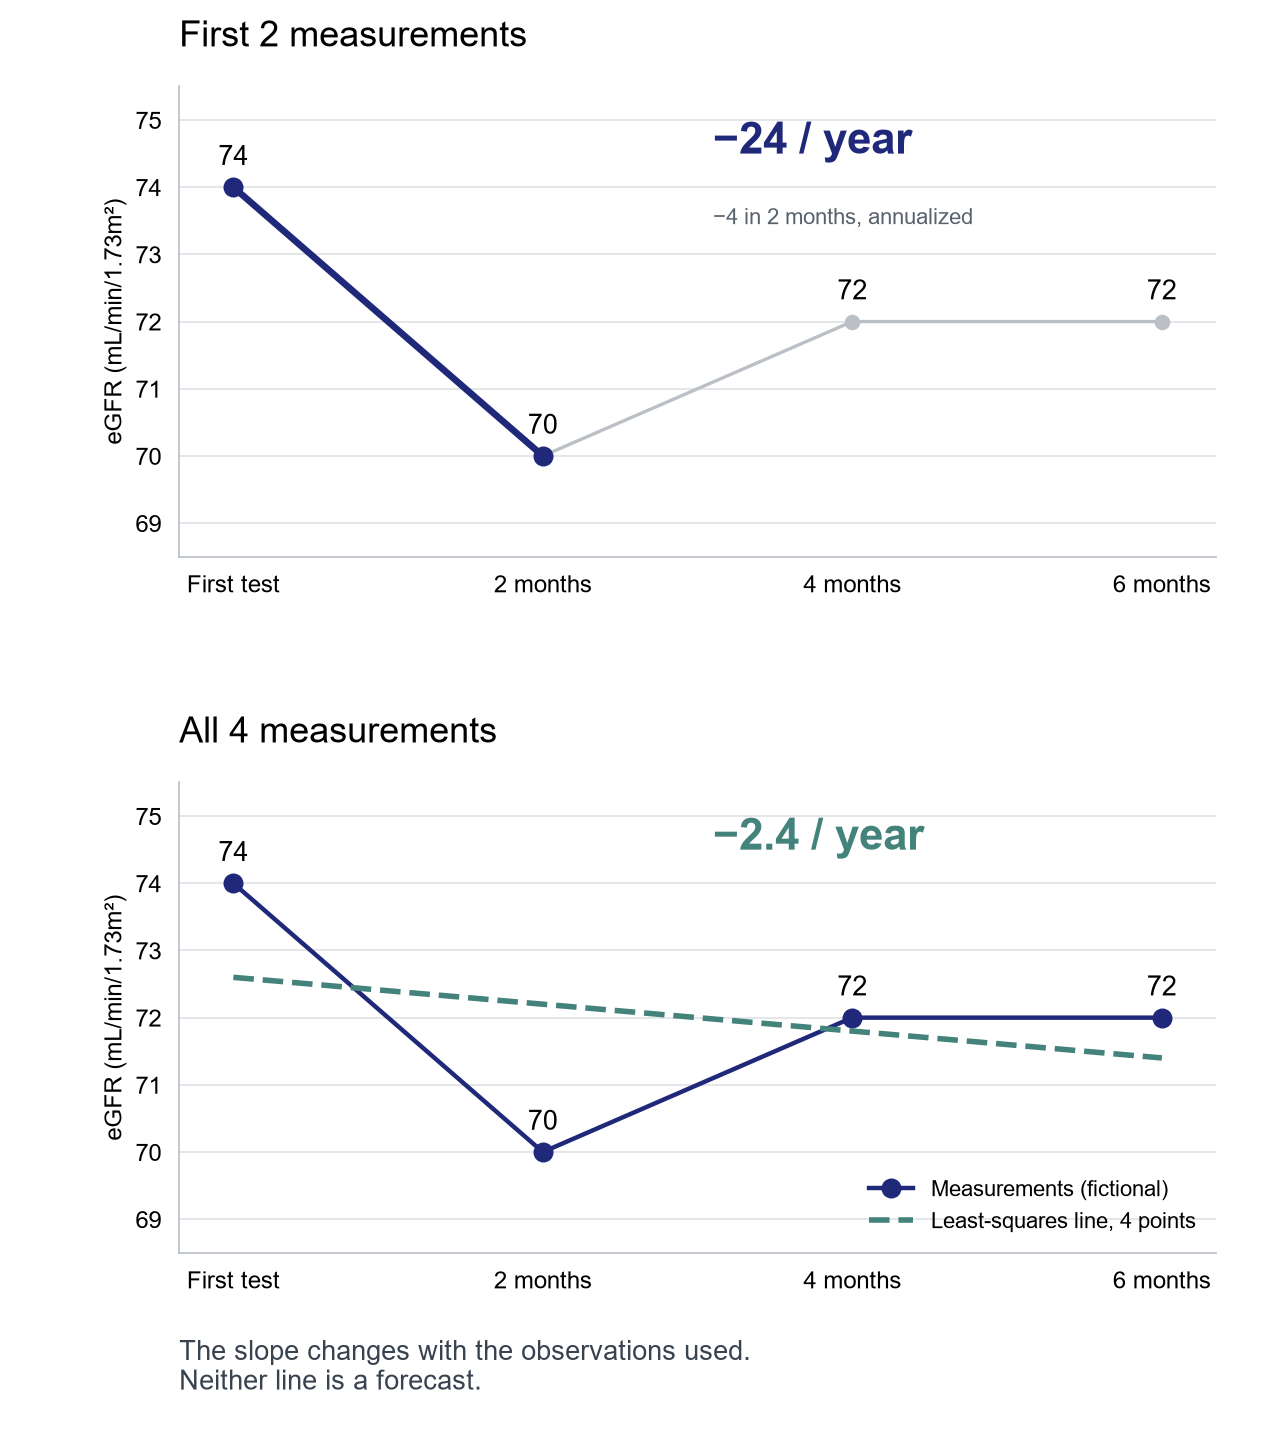
The first two tests give an annualized slope of −24. The fall from 74 to 70 is about 5.4%, a change that can occur with biological and measurement variability. But a fall of 4 over two months becomes −24 mL/min/1.73m²/year when annualized. It does not predict a fall of 24 over the coming year.
Using all four tests gives a least-squares slope of −2.4 per year. Including the later values changes the picture. The values could reflect fluctuation around the low 70s, yet the fitted line still has a small downward slope.
These data alone prove neither ongoing deterioration nor a completely stable course. Continue reviewing repeated measurements, rather than judging by a minus sign or a colour on a report. The actual pattern, urine protein and clinical condition all matter.
A change of less than 20% is not automatically harmless. Symptoms or an abrupt change still need assessment. [3]
Read the time course as well as the number
The calculated slope depends on the observation period and number of tests. A short period is more affected by temporary fluctuations; a long average may obscure a recent change. Always look at the original results as well.
Muscle mass, diet and other factors can affect creatinine-based eGFR. KDIGO 2024 advises considering variability when interpreting changes. In people with CKD, an eGFR change of more than 20% at a subsequent test warrants evaluation. This is not an annual slope threshold. [3]
After starting medicines such as SGLT2 inhibitors, eGFR can fall initially, followed by a slower long-term decline. The initial change and later course should be considered separately. Discuss results with the prescribing clinician rather than stopping treatment on your own. [3]
If an acute deterioration is suspected, its cause should be assessed without waiting for another test simply to calculate a slope.
Discuss your kidney test results
Our kidney clinic accepts patients without a referral letter, including those who continue attending another clinic and want advice about their kidneys. Please bring your health-check results, blood-test reports and medication record.
什么是eGFR斜率?通过检查结果了解肾功能的变化
看到eGFR比上次略有下降,您可能会担心。了解肾功能时,既要看本次的数值,也要看过去一段时间的变化。
eGFR斜率表示这种变化的速度。本诊所根据随诊期间的验血结果计算eGFR斜率,并将年变化量附在检查结果中提供给您。
表示每年的变化量,而不是百分比
eGFR是对肾脏过滤血液能力的估计值。以采血日期为横轴、eGFR为纵轴绘图时,斜率表示数值变化的速度。
例如,斜率为−2 mL/min/1.73m²/年,意味着在用于计算的观察期间,eGFR呈平均每年下降2个单位的趋势,并不表示肾功能每年下降2%。
负值表示下降趋势,接近零表示总体变化较小。但不能仅凭这一数值判断好坏,还要结合目前的eGFR和尿蛋白。
本次eGFR同为50,过去的变化可能不同
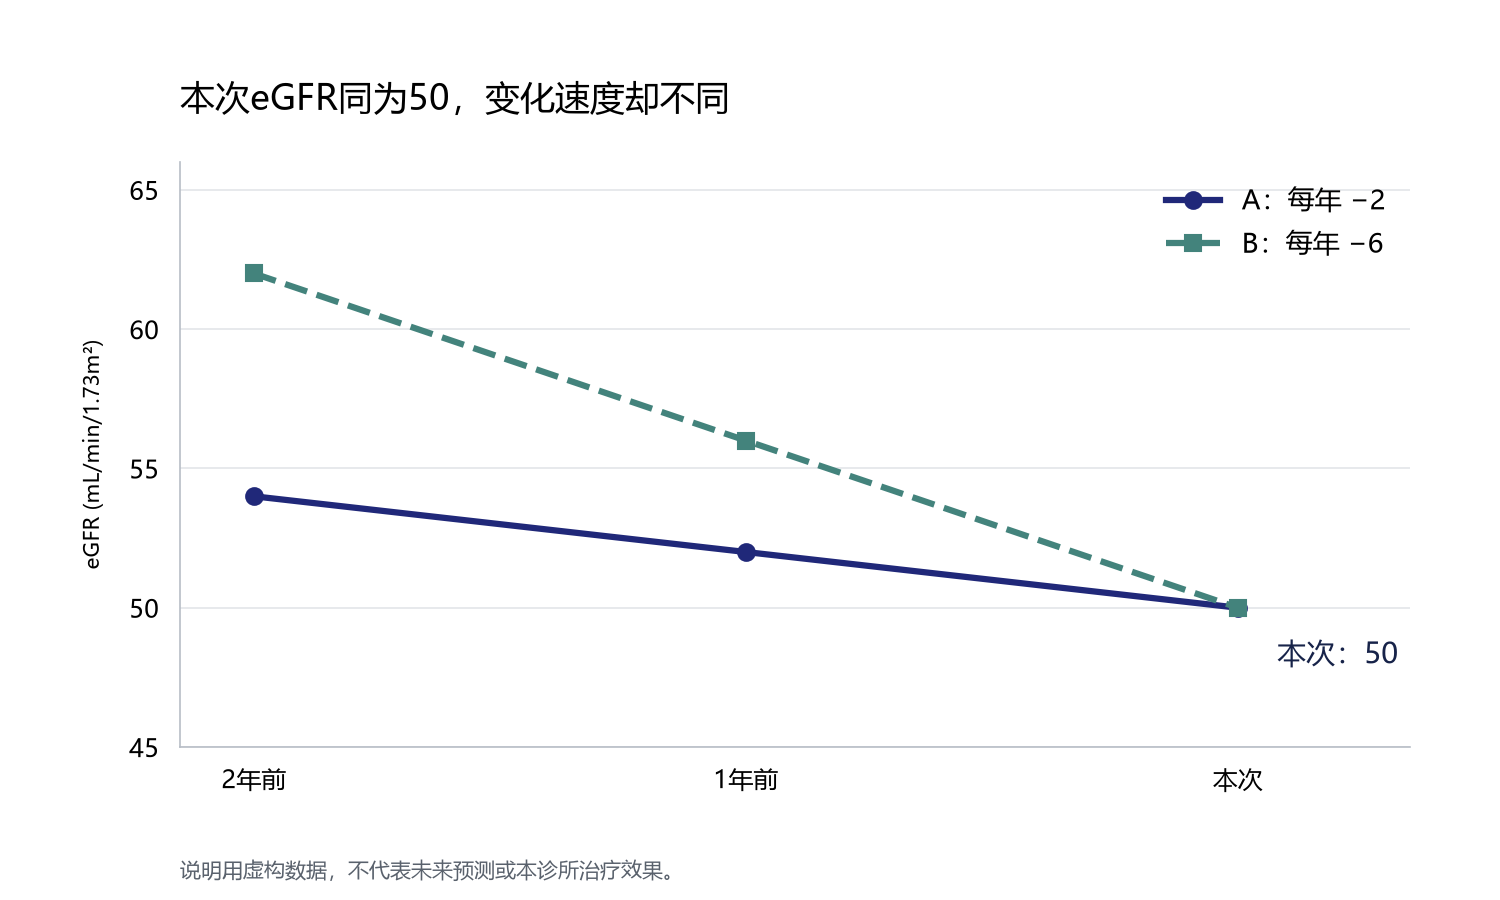
第一张图使用的是虚构的示例数据。A在两年内的数值依次为54、52、50,B为62、56、50。本次结果都是50,但年变化量分别为−2和−6。
将过去的结果放在一起,可以发现本次结果无法单独反映的差异。如果像B那样持续下降,需要确认原因并评估治疗。
不能把直线延伸到未来,就断定几年后需要透析。病情和治疗会改变后续过程。这些图不是预测,也不代表本诊所的治疗效果。
研究告诉了我们什么?
2019年汇总14个观察性队列的研究发现,eGFR下降较缓慢的人,之后发生终末期肾病的风险较低。这里说明的是关联。[1]
2023年对66项试验、186,312名受试者的分析发现,治疗对GFR斜率的影响,与其对肾衰竭等临床结局的影响有较强关联。这为在临床试验中使用斜率作为评价指标提供了依据。[2]
但大群体的研究结果,不等于某个人短期内几次验血所能说明的情况。斜率略有改善,并不足以单独证明该患者的治疗有效。
本诊所如何提供结果
本诊所使用随诊期间的多次验血结果,通过最小二乘法计算eGFR斜率。简单来说,就是为采血日期和eGFR组成的点拟合一条反映整体趋势的直线,再求出每年的变化量。
这一信息用于回顾累积的结果,而不是只关注最近两次。请将年变化量与本次eGFR一起查看。如有以往体检或其他医院的验血报告,请就诊时携带,有助于了解变化过程。
74 → 70 → 72 → 72:为什么只看两次可能产生误解?
肌酐存在生理性波动,测定结果也有一定差异。因此,由肌酐计算的eGFR不会每次都完全相同。仅用短期内两三次结果拟合直线,再换算成年变化量,可能放大这些波动。[3]
假设首次、2个月、4个月、6个月后的eGFR依次为74、70、72、72。这些是用于说明的虚构数据。
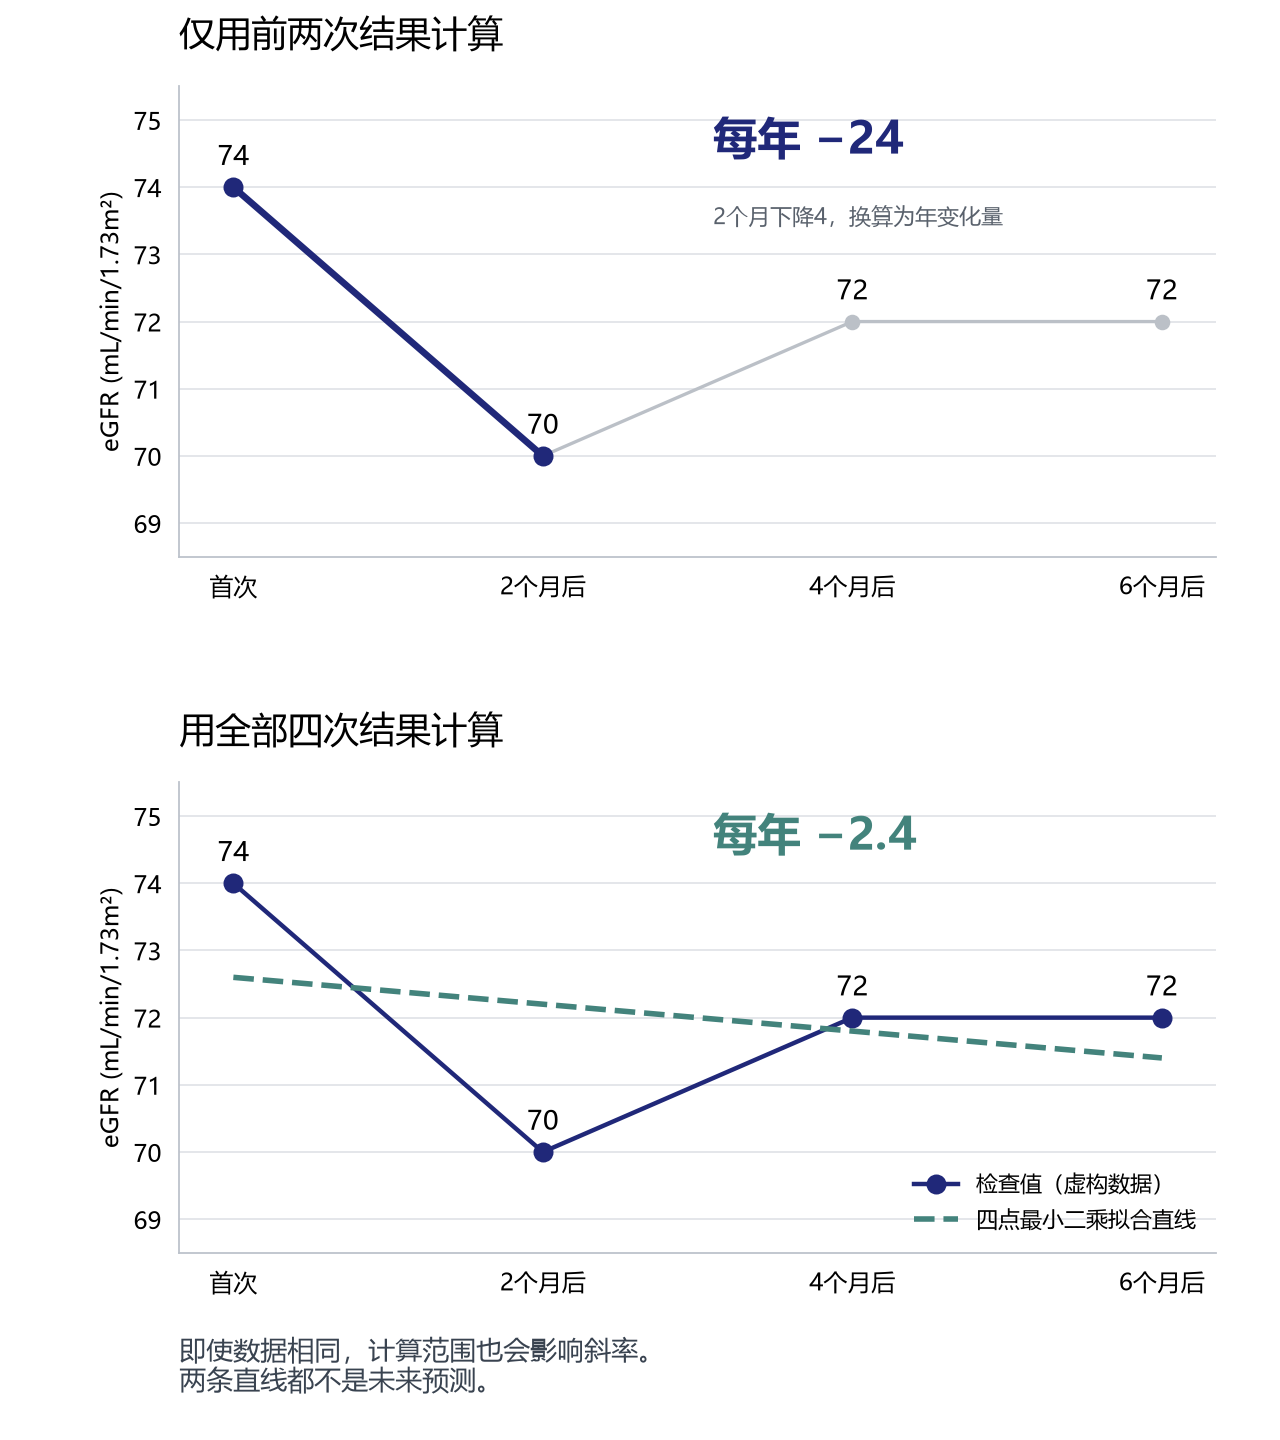
仅用前两次,换算成年斜率为−24。从74到70约下降5.4%,这种幅度也可能出现在生理性和测量波动中。但两个月下降4,换算后就成为−24 mL/min/1.73m²/年。这并不是预测未来一年会下降24。
用全部四次结果按最小二乘法计算,年斜率为−2.4。加上后来的72、72后,整体印象会改变。数值也可能是在70出头附近波动,但拟合直线仍略向下倾斜。
仅凭这个例子,既不能断定肾功能持续恶化,也不能断定完全稳定。重要的是持续查看多次验血结果,不要只根据负号或报告颜色判断,还要结合实际数值、尿蛋白和身体状况。
这也不意味着“变化在20%以内就没有问题”。有症状或突发变化时,仍需及时评估。[3]
同时关注观察时间和原始结果
计算所用的时间范围和检查次数会影响斜率。短期内少量结果容易受暂时波动影响;较长时间的平均趋势又可能掩盖近期变化。因此,要同时查看原始结果的排列。
肌肉量、饮食等因素会影响基于肌酐的eGFR。KDIGO 2024建议解释变化时考虑这些波动。对于慢性肾脏病患者,后续检查的eGFR变化超过20%时,需要评估。这不是年斜率的界限。[3]
开始使用SGLT2抑制剂等药物后,eGFR可能初期下降,之后下降速度减慢。应分别看待初期变化和后续趋势。不要仅凭检查数值自行停药,应与开药医生讨论。[3]
如果怀疑肾功能急性恶化,应查明原因,而不是为了计算斜率等待下一次采血。
希望咨询肾功能检查结果的患者
本诊所肾脏内科接受无转诊信的患者,也接受继续在其他医院就诊、同时希望咨询肾脏问题的患者。请携带体检结果、验血报告和用药记录。
¿Qué es la pendiente de la TFGe? Cómo entender los cambios en la función renal
Una pequeña bajada respecto al análisis anterior puede preocupar. Para valorar la función renal conviene mirar tanto el resultado actual como su evolución.
La pendiente de la TFGe describe la velocidad de ese cambio. TFGe es la tasa de filtración glomerular estimada, también denominada eGFR en inglés. En nuestra clínica calculamos la pendiente con los análisis de seguimiento y entregamos el cambio anual junto con los resultados.
Un cambio por año, no un porcentaje
La TFGe estima la capacidad de los riñones para filtrar la sangre. Si representamos las fechas en el eje horizontal y la TFGe en el vertical, la pendiente indica a qué velocidad cambian los valores.
Una pendiente de −2 mL/min/1,73m²/año significa que, durante el periodo utilizado, la TFGe mostró una tendencia a disminuir una media de 2 unidades al año. No significa una pérdida del 2% anual.
Un valor negativo indica una tendencia descendente; uno próximo a cero, pocos cambios globales. También deben considerarse la TFGe actual y las proteínas en la orina.
Un mismo resultado actual puede tener historias distintas
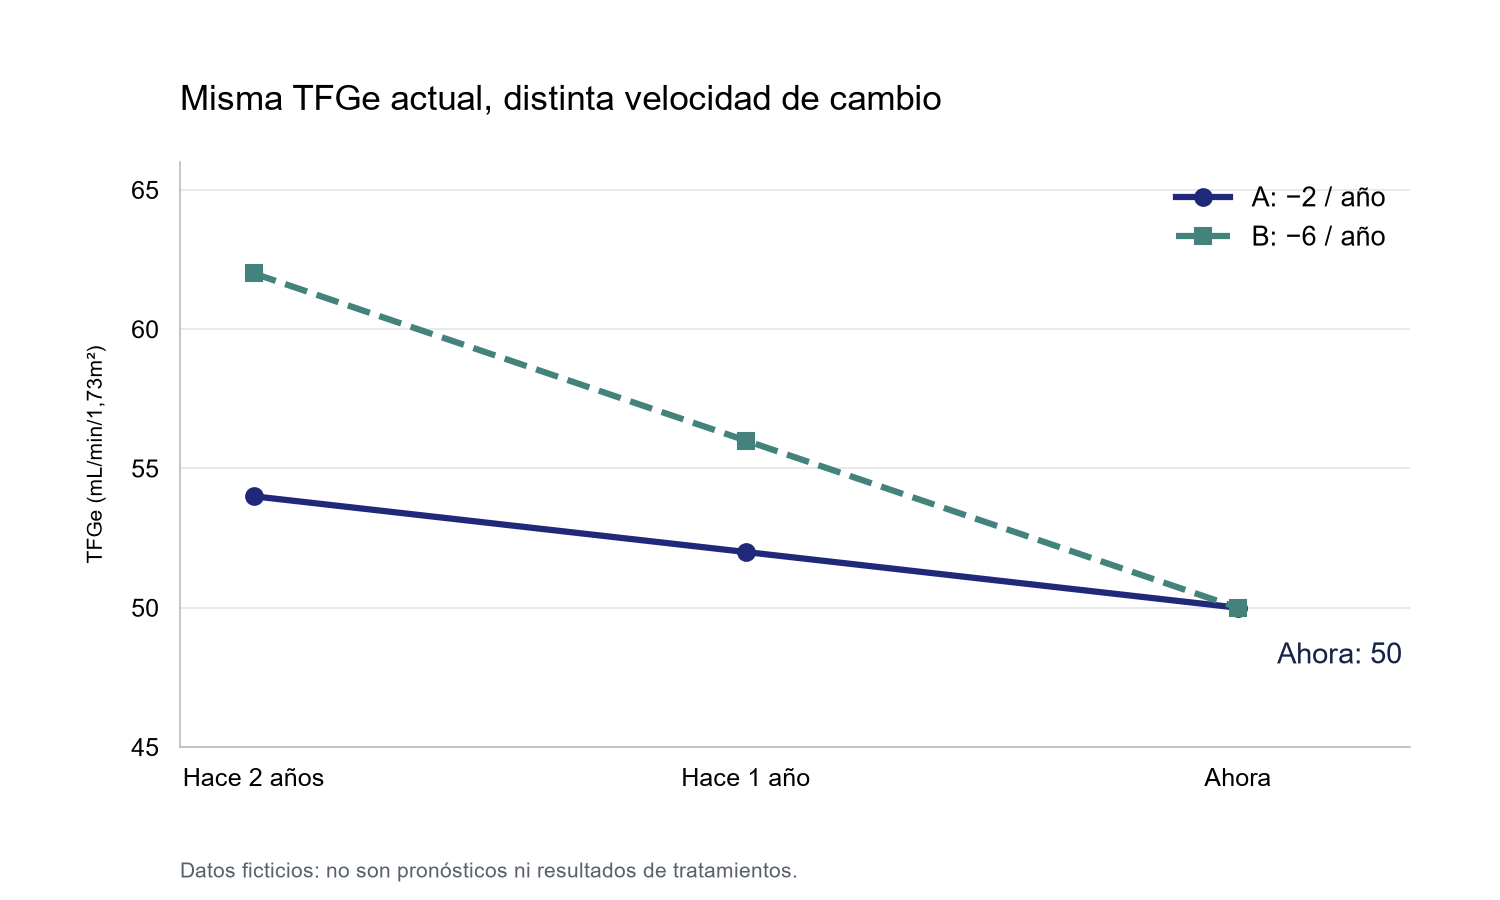
El primer gráfico muestra datos ficticios. A presenta 54, 52 y 50 a lo largo de dos años; B presenta 62, 56 y 50. Ambos tienen ahora una TFGe de 50, pero sus cambios anuales son −2 y −6.
Revisar el pasado revela diferencias que el último resultado no muestra por sí solo. Si la bajada de B se mantiene, hay que revisar la causa y el tratamiento.
No se puede prolongar la recta y afirmar cuándo será necesaria la diálisis. La enfermedad y el tratamiento pueden modificar la evolución. Los gráficos no son pronósticos ni resultados de tratamientos realizados en esta clínica.
¿Qué indican los estudios?
Un análisis de 2019 que reunió 14 cohortes observacionales encontró una asociación entre una disminución más lenta de la TFGe y un menor riesgo posterior de enfermedad renal terminal. [1]
En 2023, un análisis de 66 ensayos con 186.312 participantes encontró una relación estrecha entre los efectos del tratamiento sobre la pendiente del filtrado y sobre desenlaces clínicos como la insuficiencia renal. Esto respalda su uso como medida de resultado en ensayos clínicos. [2]
Sin embargo, los resultados de grandes grupos no demuestran el efecto de un tratamiento en una persona a partir de unos pocos análisis. Una ligera mejoría de la pendiente no basta por sí sola para demostrar eficacia.
Cómo entregamos este dato en nuestra clínica
Utilizamos varios análisis realizados durante el seguimiento y el método de mínimos cuadrados. Este ajusta una recta al conjunto de fechas y valores de TFGe, y expresa su pendiente como cambio por año.
El objetivo es revisar los resultados acumulados, en lugar de centrarse únicamente en los dos últimos. Lea el cambio anual junto con la TFGe actual. Si dispone de análisis o revisiones de otros centros, tráigalos a la consulta para ayudar a reconstruir la evolución.
74 → 70 → 72 → 72: por qué dos análisis pueden confundir
La creatinina tiene variaciones fisiológicas y las mediciones también presentan cierta variabilidad. Por eso la TFGe calculada no es idéntica en todos los análisis. Usar solo dos o tres resultados de un periodo corto puede amplificar esas oscilaciones al expresarlas por año. [3]
Imaginemos valores ficticios de 74, 70, 72 y 72 al inicio y a los 2, 4 y 6 meses.
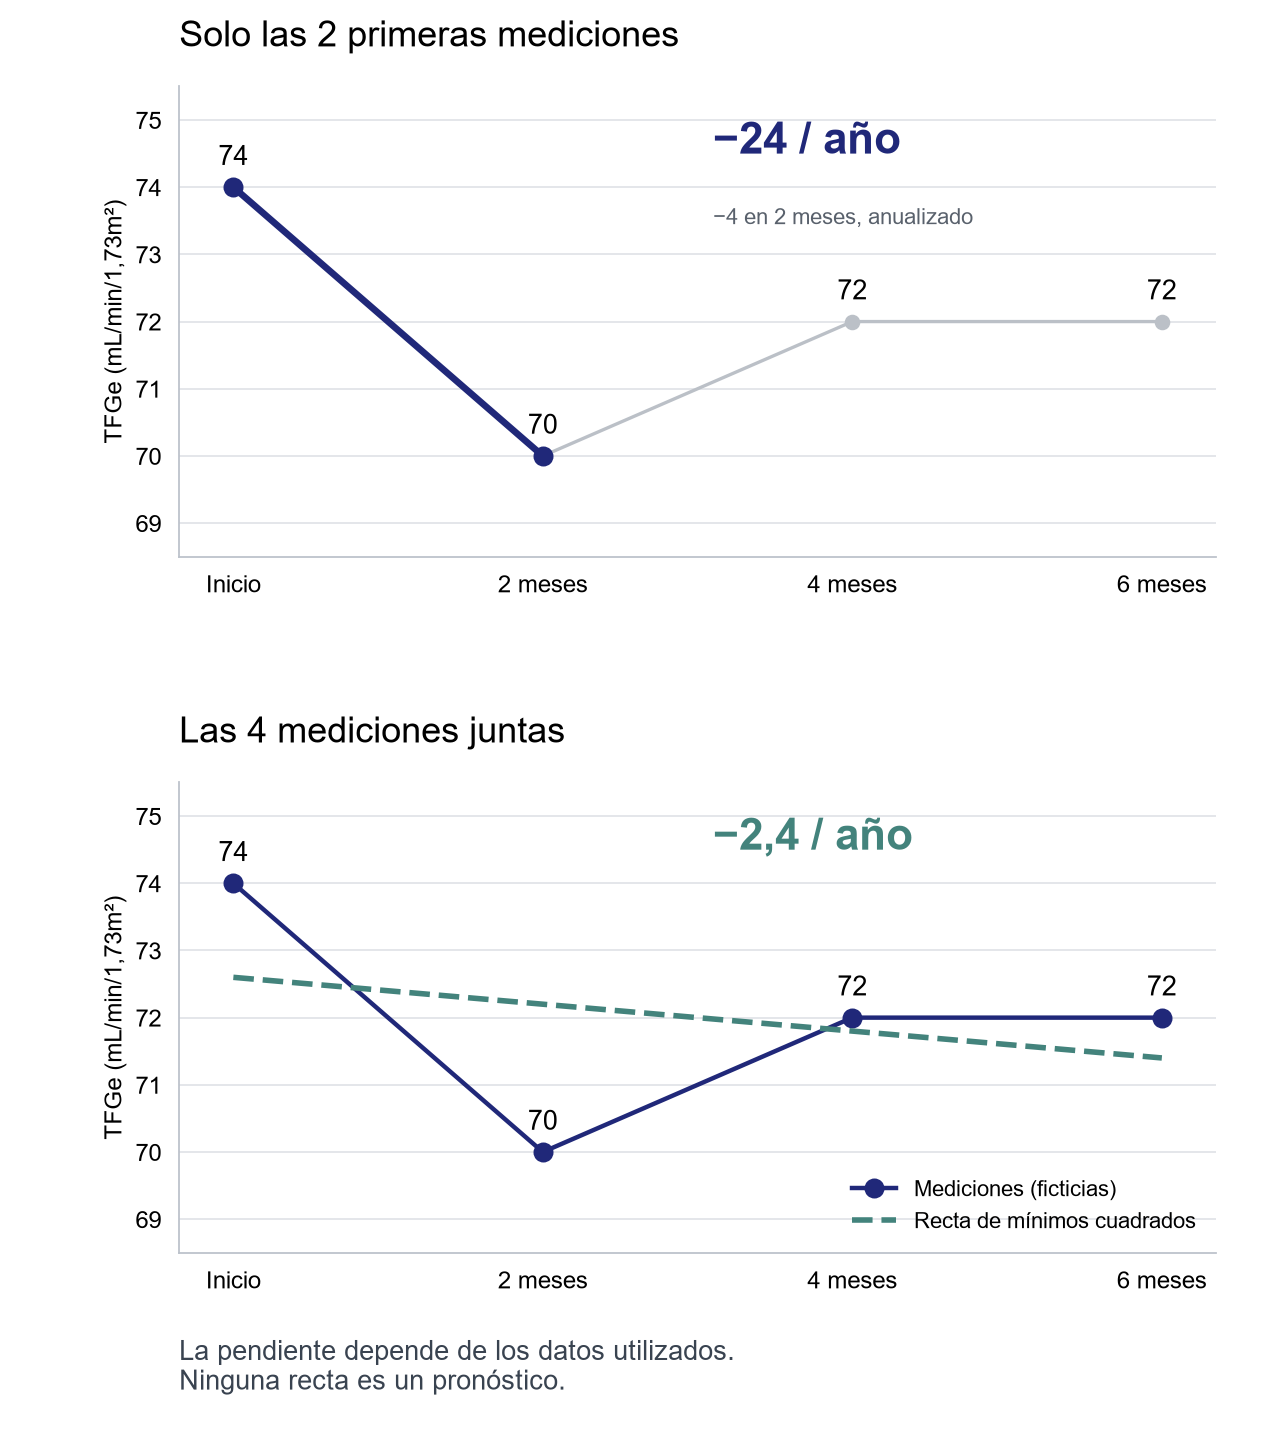
Los dos primeros dan una pendiente anualizada de −24. El paso de 74 a 70 supone aproximadamente un 5,4%, una magnitud que puede darse por variación biológica y de medición. Pero bajar 4 unidades en dos meses equivale a −24 mL/min/1,73m²/año al anualizarlo. No es una predicción de que bajará 24 durante el próximo año.
Con los cuatro resultados, mínimos cuadrados da −2,4 al año. Incluir los valores posteriores cambia la impresión. Podría tratarse de oscilaciones alrededor de los setenta y pocos, aunque la recta ajustada siga siendo ligeramente descendente.
El ejemplo no demuestra ni un deterioro sostenido ni una estabilidad completa. Es importante seguir observando resultados repetidos, sin decidir solo por un signo negativo o el color del informe. Se valoran la secuencia real, la proteína en orina y la situación clínica.
Un cambio inferior al 20% no es automáticamente inofensivo. Los síntomas y los cambios bruscos necesitan evaluación. [3]
Observe el periodo y los resultados originales
La pendiente depende de la duración del seguimiento y del número de análisis. Un periodo corto es más sensible a oscilaciones temporales; un promedio prolongado puede ocultar un cambio reciente. Conviene revisar también los valores originales.
La masa muscular, la dieta y otros factores influyen en la TFGe basada en creatinina. KDIGO 2024 recomienda considerar la variabilidad. En personas con enfermedad renal crónica, un cambio de TFGe superior al 20% en un análisis posterior requiere evaluación. No es un umbral para la pendiente anual. [3]
Tras iniciar medicamentos como los inhibidores de SGLT2, puede aparecer una bajada inicial seguida de un descenso más lento. Se deben distinguir la fase inicial y la evolución posterior. Consulte con el médico que los prescribió antes de suspenderlos por un resultado. [3]
Si se sospecha un empeoramiento agudo, hay que evaluar su causa sin esperar otro análisis solo para calcular la pendiente.
Consultar sobre los resultados renales
Nuestra consulta de nefrología acepta pacientes sin carta de derivación, incluidos quienes siguen atendidos en otro centro y desean consultar sobre sus riñones. Traiga los informes de revisiones, análisis y su registro de medicación.
eGFR 기울기란? 검사 결과로 살펴보는 신장 기능의 변화
검사 결과에서 eGFR이 지난번보다 조금 낮아지면 걱정될 수 있습니다. 신장 기능을 이해하려면 현재 수치뿐 아니라 과거부터 어떻게 변해 왔는지도 살펴보는 것이 중요합니다.
eGFR 기울기는 그 변화 속도를 나타냅니다. 본원에서는 통원 중 시행한 혈액검사 결과로 기울기를 계산하여, 연간 변화량을 검사 결과에 함께 제공하고 있습니다.
백분율이 아닌 1년당 변화량입니다
eGFR은 신장이 혈액을 걸러내는 능력을 추정한 수치입니다. 가로축에 채혈 날짜, 세로축에 eGFR을 표시했을 때 기울기는 수치가 변하는 속도를 나타냅니다.
예를 들어 기울기가 −2 mL/min/1.73m²/년이면, 계산에 사용한 기간 동안 eGFR이 연평균 2단위씩 감소하는 경향이었다는 뜻입니다. 신장 기능이 매년 2% 감소했다는 의미는 아닙니다.
음수는 감소 방향, 0에 가까운 값은 전반적으로 변화가 적은 경향을 뜻합니다. 다만 현재 eGFR과 소변 단백도 함께 고려해야 합니다.
현재 수치가 같아도 지나온 경과는 다를 수 있습니다
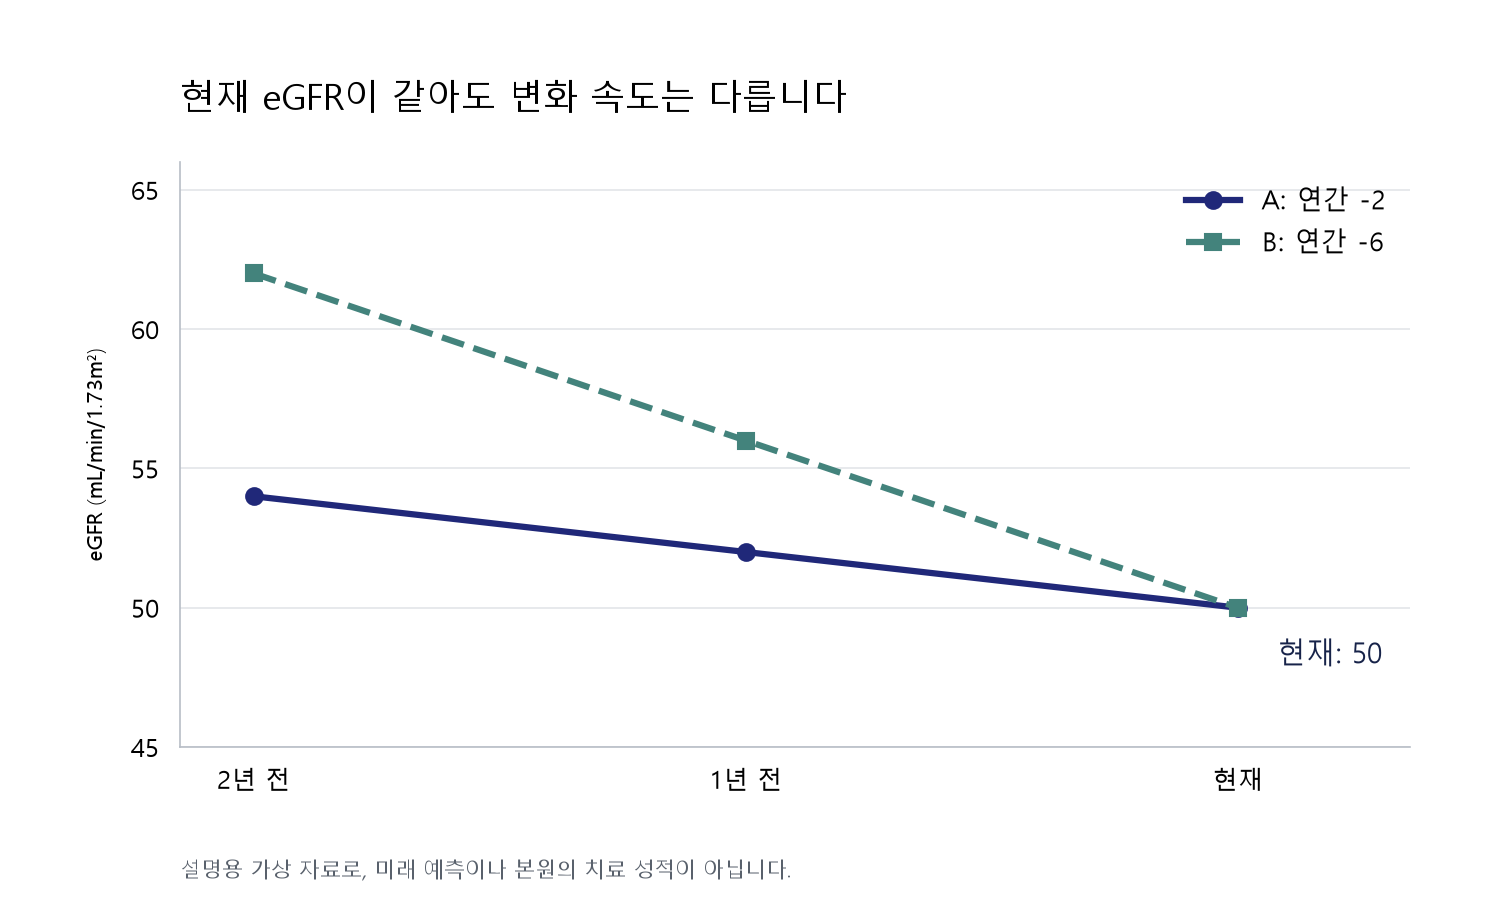
첫 그래프는 설명을 위한 가상 자료입니다. 2년 동안 A는 54, 52, 50, B는 62, 56, 50으로 변했습니다. 현재 eGFR은 모두 50이지만 연간 변화량은 각각 −2와 −6입니다.
과거 결과를 함께 보면 현재 수치만으로는 알 수 없는 차이가 드러납니다. B와 같은 감소가 계속된다면 원인과 치료 내용을 확인해야 합니다.
이 선을 미래로 그대로 늘려 몇 년 뒤 투석이 필요하다고 단정할 수는 없습니다. 질병과 치료에 따라 경과가 달라질 수 있습니다. 그래프는 미래 예측이나 본원의 치료 성적을 나타내지 않습니다.
연구에서는 무엇을 확인했나요?
2019년 14개 관찰 코호트를 종합한 연구에서는 eGFR 감소가 완만한 사람일수록 이후 말기 신장질환 위험이 낮다는 연관성이 확인되었습니다. [1]
2023년에는 66개 임상시험, 186,312명의 자료를 분석하여 GFR 기울기에 대한 치료 효과와 신부전 등의 임상 결과에 대한 치료 효과 사이에 강한 연관성을 보고했습니다. 임상시험에서 기울기를 평가 지표로 사용하는 근거입니다. [2]
하지만 많은 사람을 비교한 연구 결과와 한 사람의 단기간 검사 결과는 구분해야 합니다. 개인의 기울기가 조금 좋아졌다는 사실만으로 치료 효과를 확정할 수는 없습니다.
본원에서 결과를 제공하는 방법
본원에서는 통원 중 시행한 여러 차례의 혈액검사 결과를 사용하여 최소제곱법으로 eGFR 기울기를 계산합니다. 채혈 날짜와 eGFR로 이루어진 점들의 전체 경향에 맞는 직선을 구하고, 그 기울기를 연간 변화량으로 표시하는 방법입니다.
최근 두 결과에만 집중하지 않고 누적된 경과를 돌아보는 데 도움이 되는 정보입니다. 현재 eGFR과 연간 변화량을 함께 보시기 바랍니다. 과거 건강검진 결과나 다른 병원의 혈액검사 결과가 있다면 진료 시 가져오시면 경과를 확인하는 데 도움이 됩니다.
74 → 70 → 72 → 72: 두 번의 검사만으로 오해할 수 있는 이유
크레아티닌에는 생리적인 변동이 있고 측정에도 어느 정도 오차가 있습니다. 따라서 이를 이용해 계산한 eGFR도 매번 같지는 않습니다. 짧은 기간의 두세 번 결과만으로 직선을 구해 연간 수치로 환산하면 작은 변동이 크게 보일 수 있습니다. [3]
처음과 2개월, 4개월, 6개월 뒤 eGFR이 74, 70, 72, 72였다고 가정해 보겠습니다. 설명용 가상 자료입니다.
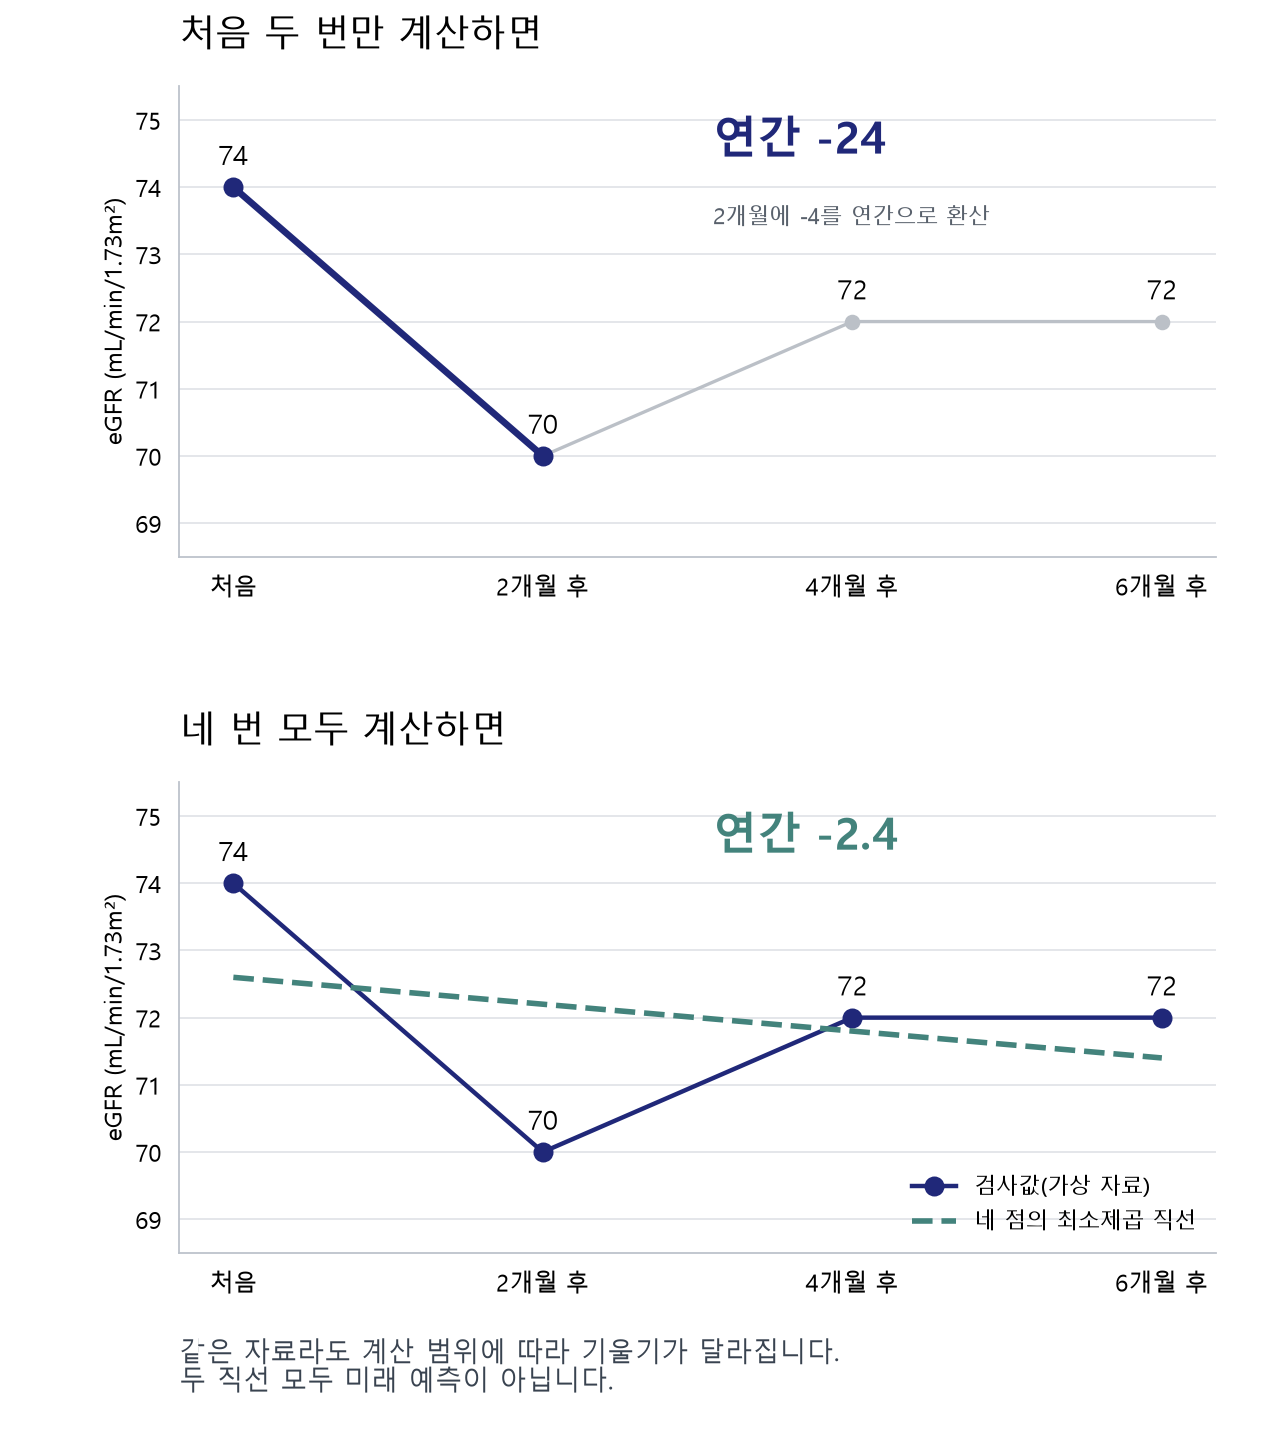
처음 두 번만으로 계산하면 연간 −24입니다. 74에서 70으로의 변화는 약 5.4%로, 생리적·측정상 변동으로도 나타날 수 있는 크기입니다. 하지만 2개월에 4가 낮아진 것을 연간으로 환산하면 −24 mL/min/1.73m²/년이 됩니다. 앞으로 1년 동안 24가 감소한다는 예측이 아닙니다.
네 번 모두 최소제곱법으로 계산하면 연간 −2.4입니다. 이후의 72, 72를 포함하면 인상이 달라집니다. 70대 초반에서 오르내리는 경과일 수도 있지만, 계산한 직선에는 여전히 약한 하향 기울기가 남습니다.
이 예만으로 지속적인 악화나 완전한 안정 상태를 확정할 수는 없습니다. 음수 기호나 보고서의 색만 보지 말고 여러 차례의 검사 결과를 계속 확인하는 것이 중요합니다. 실제 수치의 배열, 소변 단백과 몸 상태를 함께 살펴봅니다.
20% 이내의 변화라면 무조건 괜찮다는 뜻도 아닙니다. 증상이나 갑작스러운 변화가 있다면 평가가 필요합니다. [3]
관찰 기간과 원래 수치를 함께 읽습니다
기울기는 계산에 사용하는 기간과 검사 횟수에 따라 달라집니다. 짧은 기간의 적은 측정은 일시적인 변동에 영향을 받기 쉽고, 긴 기간의 평균은 최근 변화를 가릴 수 있습니다. 원래 검사 결과도 함께 보아야 합니다.
근육량이나 식사 등은 크레아티닌 기반 eGFR에 영향을 줄 수 있습니다. KDIGO 2024는 변화를 해석할 때 이러한 변동을 고려하도록 합니다. 만성 신장질환 환자의 후속 검사에서 eGFR이 20% 넘게 변하면 평가가 필요합니다. 이는 연간 기울기의 기준이 아닙니다. [3]
SGLT2 억제제 등의 치료를 시작하면 초기에는 eGFR이 낮아지고 이후 감소가 완만해질 수 있습니다. 초기 변화와 그 이후 경과를 나누어 봅니다. 검사 수치만으로 임의로 약을 중단하지 말고 처방한 의사와 상의하세요. [3]
급격한 신장 기능 악화가 의심된다면 기울기를 계산하려고 다음 채혈까지 기다리지 말고 원인을 평가해야 합니다.
신장 기능 검사 결과를 상담하고 싶은 분께
본원 신장내과는 진료의뢰서가 없는 분도 진료합니다. 다른 병원에 계속 다니면서 신장 문제를 상담하고 싶은 분도 방문할 수 있습니다. 건강검진 결과, 혈액검사 결과와 복약 기록을 가져오세요.
医療関係者向けの解説
eGFRスロープは、観察期間内の腎機能の変化を年あたりの量として要約する指標です。個人の経時的な評価に用いる場合は、推定値と元の測定値を併せて読み、臨床試験における代替エンドポイントとしての根拠とは区別します。
最小二乗法で何を推定しているか
採血時点を年単位の経過時間 t、各時点のeGFRを y とし、切片を含む直線 y = a + bt を当てはめます。通常の最小二乗法では、各測定値と直線との縦方向の差の二乗和が最小になるように a と b を求めます。
b = Σ[(tᵢ − t̄)(yᵢ − ȳ)] / Σ[(tᵢ − t̄)²]
b の単位はmL/分/1.73m²/年であり、年間の百分率変化ではありません。不等間隔の採血では実際の採血日を用い、単なる測定順を時間軸の代わりにしないことが必要です。
得られるのは、使用した観察期間を一本の直線で要約した傾きです。直線を当てはめたこと自体は、腎機能が直線的に変化することや、今後も同じ速度で推移することの証明にはなりません。
短期間の変動は、年換算で大きく見える
初回、2か月後、4か月後、6か月後のeGFRを、説明用に74、70、72、72とします。
最初の2点では (70 − 74) ÷ (2/12) = −24。4点を年単位の時間軸で回帰すると −2.4 です。同じ系列でも、算出範囲を変えると推定値が大きく変わります。
74から70への相対変化は約−5.4%です。クレアチニンの生物学的変動や分析上のばらつきはeGFRにも反映されますが、この例だけから変化の原因を生理的変動と断定することはできません。[3]
4点でも回帰係数は負の値となります。しかし、負の係数が得られたことと、持続的な腎機能低下が確認されたことは同義ではありません。測定回数、観察期間、値のばらつき、急性疾患や治療変更の時期を確認し、尿所見や臨床経過と照合します。
予後との関連と、治療効果の代替指標を分けて考える
Gramsらの14コホートの解析では、2年間のeGFR低下速度が0.75 mL/分/1.73m²/年緩やかなことは、その後のESKDリスク低下と関連しました。調整ハザード比は、ベースラインeGFRが60以上の群で0.70、60未満の群で0.71でした。これは観察研究における関連であり、個々の患者の治療効果をそのまま数値化するものではありません。[1]
Inkerらの66試験・186,312人を用いたメタ解析は、GFRスロープに対する治療効果と、腎不全などの臨床アウトカムに対する治療効果との関連を評価しています。集団・試験レベルでの代替指標の妥当性と、少数回の採血から求めた個人の傾きの確実性は、別の問題です。[2]
KDIGO 2024のPractice Point 2.1.3では、CKD患者の次回検査で20%を超えるeGFR変化があれば、予想される変動を超えるため評価を要するとしています。この基準は年間スロープのカットオフではなく、20%以内なら評価不要という意味でもありません。[3]
SGLT2阻害薬導入後などの初期変化を含む期間と、その後の期間では、推定される傾きが異なる場合があります。算出期間と治療開始時点を確認し、一つのスロープだけで長期の治療効果を結論づけないようにします。[3]
eGFR slope: estimation and clinical interpretation
eGFR slope summarizes the change in kidney function over an observation period as an annual rate. When interpreting an individual’s trajectory, review the underlying measurements alongside the estimate, and distinguish this use from the evidence supporting GFR slope as a surrogate endpoint in clinical trials.
What does least-squares regression estimate?
Let t denote elapsed time in years at blood sampling, and y the corresponding eGFR. Fit the line y = a + bt, including an intercept. Ordinary least squares chooses a and b to minimize the sum of squared vertical residuals between the observed values and the fitted line.
b = Σ[(tᵢ − t̄)(yᵢ − ȳ)] / Σ[(tᵢ − t̄)²]
The units of b are mL/min/1.73m²/year, not percentage change per year. For irregularly spaced samples, use actual elapsed time rather than the sequence number of each measurement.
The result is a linear summary of the selected observation period. Fitting a straight line does not establish that kidney function changes linearly or that the same rate will continue.
Annualization can magnify short-term fluctuations
Consider fictional eGFR values of 74, 70, 72 and 72 at baseline and at 2, 4 and 6 months.
The first two values yield (70 − 74) ÷ (2/12) = −24. Regression using all four values with time expressed in years yields −2.4. Changing the observation window substantially changes the estimate, even within the same series.
The relative change from 74 to 70 is approximately −5.4%. Biological variation in creatinine and analytical variability affect eGFR, but these data alone cannot establish that the change is physiological. [3]
The four-point regression coefficient remains negative. A negative coefficient is not equivalent to confirmed progressive loss of kidney function. Review the number and timing of measurements, observation period, scatter, acute illness and treatment changes, together with urine findings and the clinical course.
Prognostic association and surrogacy are different questions
In the 14-cohort analysis by Grams and colleagues, an eGFR decline that was 0.75 mL/min/1.73m²/year slower over two years was associated with a lower subsequent risk of ESKD. Adjusted hazard ratios were 0.70 for participants with baseline eGFR ≥60 and 0.71 for those with eGFR <60. These observational associations do not directly quantify treatment benefit in an individual. [1]
The meta-analysis by Inker and colleagues, comprising 66 trials and 186,312 participants, evaluated the relationship between treatment effects on GFR slope and on clinical outcomes including kidney failure. Evidence for trial-level surrogacy and the precision of an individual slope based on a small number of measurements address different questions. [2]
KDIGO 2024 Practice Point 2.1.3 states that, in people with CKD, a change in eGFR of more than 20% on a subsequent test exceeds expected variability and warrants evaluation. This is not a cutoff for annual slope; changes within 20% do not automatically require no further assessment. [3]
Estimates may differ between a period that includes an initial change after starting treatment, such as an SGLT2 inhibitor, and a later period. Check the calculation window against treatment initiation, and avoid attributing long-term efficacy to a single slope estimate. [3]
参考文献 / References
- Grams ME, et al. Evaluating Glomerular Filtration Rate Slope as a Surrogate End Point for ESKD in Clinical Trials: An Individual Participant Meta-Analysis of Observational Data. J Am Soc Nephrol. 2019;30:1746–1755. PubMed/DOI
- Inker LA, et al. A meta-analysis of GFR slope as a surrogate endpoint for kidney failure. Nat Med. 2023;29:1867–1876. PubMed/DOI
- KDIGO 2024 Clinical Practice Guideline for the Evaluation and Management of Chronic Kidney Disease. Kidney Int. 2024;105(Suppl 4S):S117–S314. Practice Points 1.2.2.5、2.1.3、3.7.3. ガイドライン全文